Weekly Market Summary... January 5, 2024
A look at the week’s prices, trends, and news for the cattle/beef complex.
View Complete Summary • • Subscribe to receive via e-mail • • Archive
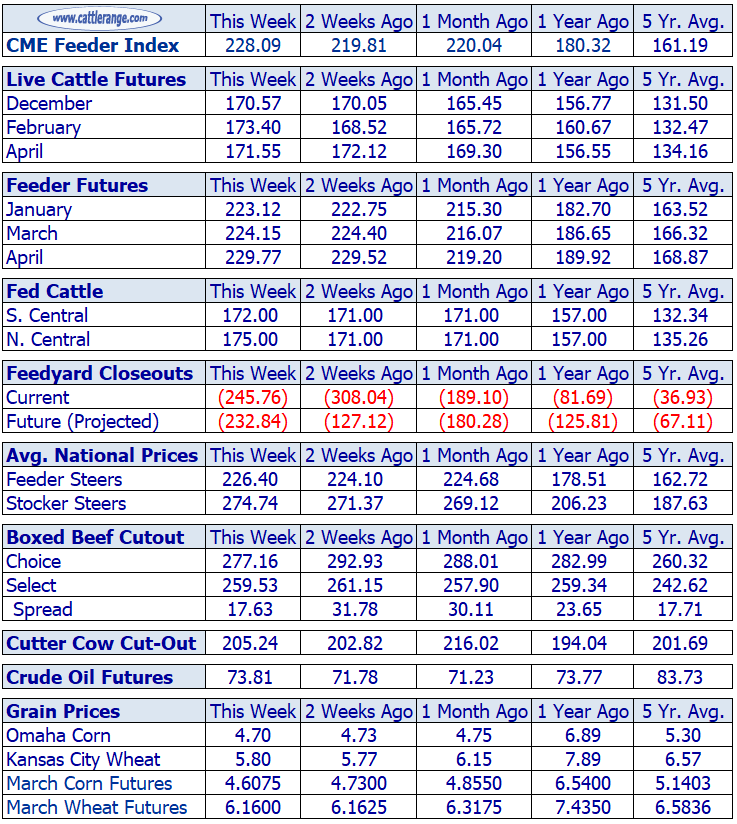
For the week, fed cattle trade in the South Plains was non-existent with North Plains trade 4.00 higher at 175.00. Feeder cattle were 2.00 higher with stocker calves 3.00 higher. Live cattle futures and feeder cattle futures were mixed. The Choice dressed beef cutout was sharply lower with corn slightly lower.

Cattle/Beef Market Velocity Trendlines +/-
Indexes track the daily market values for the past 10 & 60 days. Each daily value is the weighted total of the Gain/(Loss) for 15 market factors compared to the previous trading day.
10-Day Index Trendline

Change from Previous Day: -0.84%
Change from 10 Days Ago: +0.86%
60-Day Index Trendline

Change from 60 Days Ago: -22.71%
Change from 60 Day High: -22.71%
Fed Cattle: No trade in the South with Northern trade 4.00 higher at 175.00. In the 3 front months, Live Cattle futures closed the week from 0.57 lower to 4.88 higher. USDA’s carcass weight data showed weights averaged 942 lbs. this week, compared to 941 lbs. last week, and 920 lbs. last year.
- S: Last Week: 172.00 / Month Ago: 171.00 / Year Ago: 157.00 / 5 Year Avg: 132.34
- N: This Week: 175.00 / Month Ago: 171.00 / Year Ago: 157.00 / 5 Year Avg: 135.26
Feeder Cattle: The national average price for feeder steers was 226.40, 2.29 higher with trade mostly 2.00 to 5.00 higher. In the 3 front months, Feeder Cattle futures closed the week from 0.25 lower to 0.37 higher.
- This Week: 226.40 / Month Ago: 224.68 / Year Ago: 178.51 / 5 Year Avg: 162.72
Stocker Calves: The national average price for stocker steers was 274.74, 3.37 higher with trade mostly in a range of 2.00 lower to 7.00 higher.
- This Week: 274.74 / Month Ago: 269.12 / Year Ago: 206.23 / 5 Year Avg: 187.63
CME Feeder Cattle Index: 228.09, 8.28 higher than last Friday.
- This Week: 228.09 / Month Ago: 220.04 / Year Ago: 180.32 / 5 Year Avg: 161.19
Boxed Beef Cutouts: The Choice cutout was 15.77 lower at 277.16 and the Select cutout 1.62 lower at 259.53. The Choice/Select spread at 17.63, 14.15 narrower.
- This Week: 277.16 / Month Ago: 288.01 / Year Ago: 282.99 / 5 Year Avg: 260.32
Cutter Cow Cutout: 2.42 higher at 205.24.
Slaughter Cows: Trade mostly 2.00 lower to 3.00 higher.
Total red meat production under Federal inspection for the week ending Saturday, January 6th was estimated at 986.9 million lbs. according to USDA Marketing Service. This was 8.2 percent higher than a week ago and 0.1 percent higher than a year ago. Cumulative meat production for the year to date was 0.1 percent higher compared to the previous year.
Corn: Omaha Corn was 0.03 lower at 4.70 with March futures at 4.6075, 0.1225 lower.
View Complete Summary...
The summary contains 40+ pages of market data, charts, auction results, etc., with a convenient index at the top from which you can ‘click’ on content of interest and not have to scroll through all of the pages.
-
Printable Version • • Archive
-
Subscribe to receive via e-mail Saturday mornings around 7:00 AM